[ this is a first draft of a chapter in Evolve, comments are appreciated ]
Healthy organizations share information promiscuously to speed communication and generate tacit knowledge. Share current, important, non-urgent information using information radiators.
In 1966 the New York Stock Exchange installed a huge electronic board that displayed the stock prices of every company on the exchange. The constant flurry of Exchange operations revolved around this board, kept everyone informed, and helped NYSE grow into the largest exchange in the world. Even today people refer to the Exchange as the “Big Board.â€
Usually we record and deliver our knowledge work in documents, documents trapped inside a computer or in a pile on someone’s desk. Imagine for a moment you are at the airport leaving for vacation. Your flight is delayed, and to find out the current departure time you and everyone else on the flight need to refer to a printed report at the gate that is updated every half hour (actually, given the efficiency of some airlines, I’m surprised this isn’t the case). Whether it’s a stock exchange, an airport, or a fast food restaurant, moving information out of documents and into the workplace helps people work faster.
Try it now
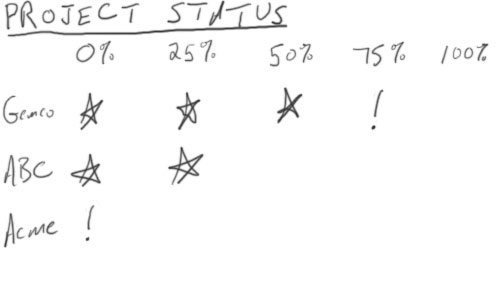
Isolate the most important information that is needed by most team members most of the time. It could be the status of each activity, how much work is left on each project, or the stage of completion for each activity. In a public area like a hallway, mount a whiteboard or poster board to track this information. Use highly visual formats like calendars, graphs, or charts so passersby can absorb updates quickly. Make it easy for everyone to make updates by leaving markers or sticky notes nearby.

Guidelines:
- Radiate information that is current, important, but non-urgent
- Show the state of progress but don’t try to represent process
- Make it visible to everyone in a high-traffic area like a hallway or kitchen
- Don’t format it in a way that’s too pretty, precious, or permanent. By designing it so it looks editable and supplying tools like markers to modify it you make it easy for team members to update
If the information needs to last a long time independently of people or teams at a company, use a format that will be found easily by subsequent employees. For more permanence, stronger materials like metal plaques can radiate long-lasting ideas like organizational values. Or you can locate information outside the organization, such as by publishing a book.
References:
Comments
3 responses to “Radiate information – First Draft”
Very interesting. It would be cool if you could give some examples of these, to help stir the creative juices. I know that at my first startup, we had a blackboard with the names of all the potential clients on it, and I’d go over it with the VP of sales to see how we were doing.
A customer used this method to track the status of a significant number of professional service projects. Same basic concept, and in a very visible place.
At one point, I put a bunch of stories for an interative release of a project on the cube wall next to mine, but people didn’t seem to give a damn.
The most conspicuous failed project I’ve ever been involved with was huge and invisible, a very bad combination. I think some visual aids would have helped that project immensely.
I think you have to be very careful about refusing process “infection”. Many, many people can’t make the leap between the specific state(s) of a process flow, and the more general concept of “25%” done. If they can’t see an apples to apples comparison, they don’t feel that the “25%” is legitimate. They may be right, but at the same time, if you do include the process flow, it gets messy, convoluted and hard for the average person to follow (think Gantt chart).
There are a number of examples in my article on Big Visible Charts, at http://www.xprogramming.com/xpmag/BigVisibleCharts.htm . Enjoy!
Marc Rettig has some interesting examples of formatting and constructing these…
http://www.marcrettig.com/writings/rettig.walls.72dpi.pdf (2MB)
As does Alistair Cockburn…
http://alistair.cockburn.us/crystal/articles/evabc/earnedvalueandburncharts.htm